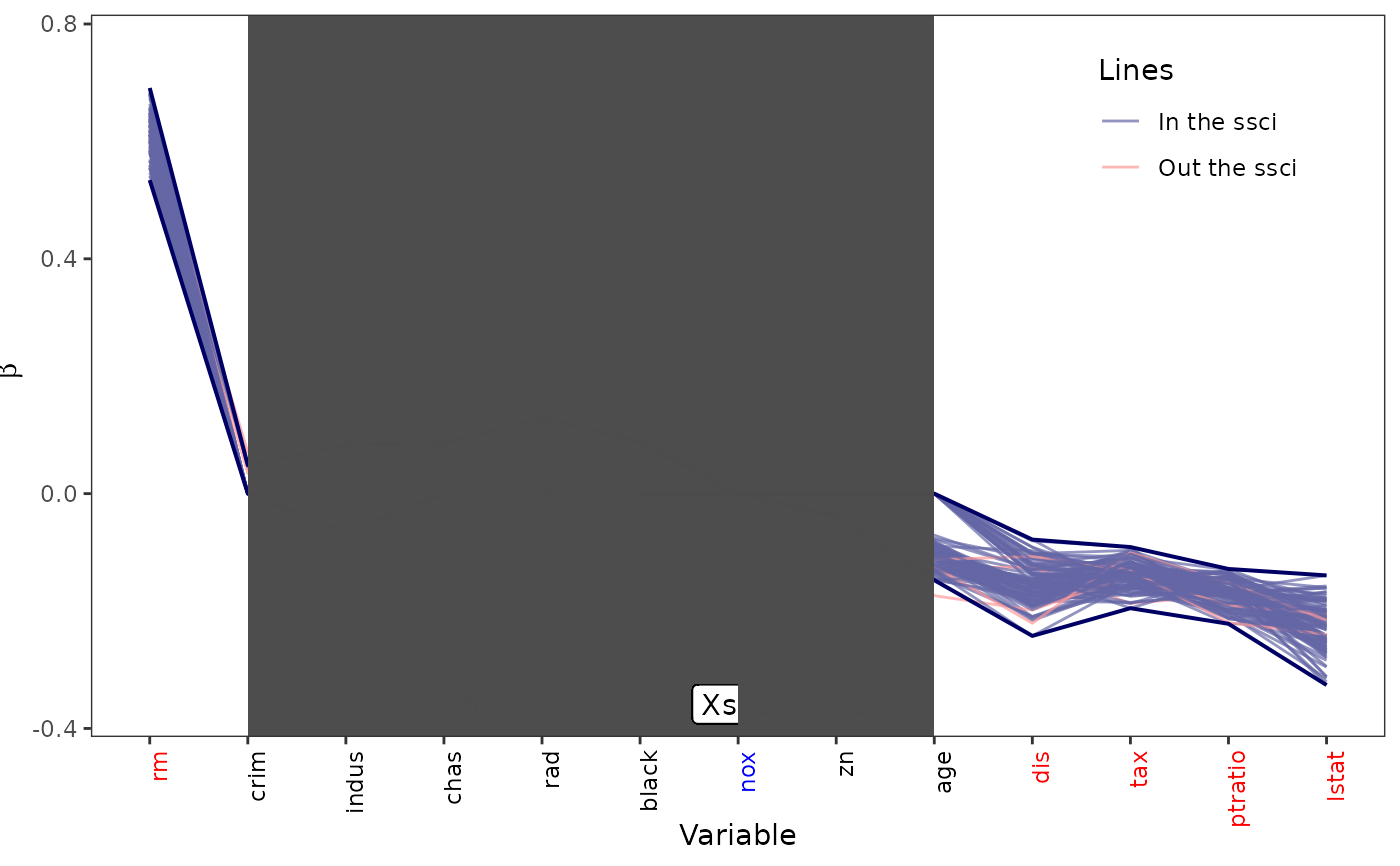
ssci_plot function to generate SSCI plot for the simultaneous confidence intervals and all bootstrap models. This plot shows from the intervals with all positive bounds, to above x-axis(cover x-axis), below x-axis(cover x-a), then, all negative.
ssci_plot.Rdssci_plot function to generate SSCI plot for the simultaneous confidence intervals and all bootstrap models. This plot shows from the intervals with all positive bounds, to above x-axis(cover x-axis), below x-axis(cover x-a), then, all negative.
Usage
ssci_plot(
  x,
  display.p = 10,
  nonhide_n = 13,
  by.Tnon0 = TRUE,
  display_bs = TRUE,
  display_bs_in = FALSE,
  text_show = TRUE,
  col_x = FALSE,
  rescale = FALSE,
  shade = FALSE,
  multiple = 3,
  n_set_C = 8,
  caption = "Sparsified simultaneous confidence intervals",
  abs_coef = FALSE,
  true.beta = NULL,
  ...
)
Arguments
- x
input a "ssci" class object
- display.p
the number of variables displayed
- nonhide_n
the number of covariates to show when there are a lot of small intervals covering 0. Default is 3.
- by.Tnon0
logical argument that specify the order of displayed covariates, default is FALSE showing by original index, if TRUE, show covariates by the relative magnitude of estimated coefficients.
- display_bs
logical argument that whether the bootstrap estimators are displayed
- display_bs_in
logical argument that whether only the bootstrap estimators inside the tube are displayed
- text_show
logical argument whether draw the text of hide variables
- col_x
logical argument whether color x labels by the group. The significant covarites are red, plausible group is grey, and the unimportant covariates are in blue.
- rescale
Logical argument whether shrink the middle groups to create neat plot
- shade
Logical argument whether use shaded area for groups in the middle
- multiple
A multiple to adjust the ratio between shaded area and both sides (if this length is 1), middle groups' area will be 1*multiple
- n_set_C
default number of covariates to show on the plot is 8
- caption
add caption for customized purpose.
- abs_coef
logical argument that all coefficients are shown in absolute magnitude
- true.beta
true or reference beta (coefficient estimates), if it is unknown, leave it as NULL. If want to compare a certain vector of coefficients, input them here as a reference.
- ...
Additional optional arguments.
Examples
data(Boston2)
Xdata <- as.matrix(Boston2[,-14]); Ydata <- Boston2[,14]
Xdata[,"crim"] <- log(Xdata[,"crim"])
Xdata[,"tax"] <- log(Xdata[,"tax"])
Xdata[,"lstat"] <- log(Xdata[,"lstat"])
Xdata[,"dis"] <- log(Xdata[,"dis"])
Xdata[,"age"] <- log(Xdata[,"age"])
Ydata <- scale(Ydata)
for (i in 1:(ncol(Xdata))){
   Xdata[,i] <- scale(Xdata[,i])
}

BostonClean <- data.frame(medv = Ydata, Xdata)


ssci_Boston <- ssci(x = Xdata, y = Ydata,
                  intercept = FALSE,
                  family = "gaussian",
                  bootstrap_rep = 100,
                  alpha=0.05
                  )

ssci_1 <- ssci_plot(x = ssci_Boston,
                   display.p = 7,
                   display_bs = TRUE,
                   text_show = TRUE, col_x = TRUE,
                   shade = TRUE)
#> # True coefficients are not being drawn due to missing! #
#> Warning: Vectorized input to `element_text()` is not officially supported.
#> ℹ Results may be unexpected or may change in future versions of ggplot2.
ssci_1
#> Warning: All aesthetics have length 1, but the data has 1300 rows.
#> ℹ Please consider using `annotate()` or provide this layer with data containing
#>   a single row.
#> Warning: All aesthetics have length 1, but the data has 1300 rows.
#> ℹ Please consider using `annotate()` or provide this layer with data containing
#>   a single row.
#> Warning: All aesthetics have length 1, but the data has 1300 rows.
#> ℹ Please consider using `annotate()` or provide this layer with data containing
#>   a single row.
#> Warning: All aesthetics have length 1, but the data has 1300 rows.
#> ℹ Please consider using `annotate()` or provide this layer with data containing
#>   a single row.
#> Warning: All aesthetics have length 1, but the data has 1300 rows.
#> ℹ Please consider using `annotate()` or provide this layer with data containing
#>   a single row.
#> Warning: All aesthetics have length 1, but the data has 1300 rows.
#> ℹ Please consider using `annotate()` or provide this layer with data containing
#>   a single row.
